Klarvyn — AI Marketing Attribution Platform
AI-Powered Marketing Attribution

your ads are
lying. we show the truth.

Every ad platform over-counts conversions. Klarvyn gives you contact-level attribution so you can see exactly which campaigns, creatives, and channels actually drive revenue.

Get Started Free
📊
Attribution — Last 30 days
Model: Data Driven
Spend
$24,800
Leads
847
Customers
142
Revenue
$89,400
ROAS
3.6x
ChannelSpendLeadsCustomersRevenueROAS
▶ Google Ads$8,20031248$34,2004.2x
▶ Meta Ads$12,40042372$42,0803.4x
▶ TikTok Ads$4,20011222$13,1203.1x
Revenue trend +18.3%
Blended ROAS 3.6x avg
Klarvyn AI
Your Meta ROAS is up 22% this week. The TOF Interest campaign is driving most of the lift — consider scaling budget.
Ask anything...

You don't need more data.
You need the right data, fast.

Most attribution tools drown you in dashboards, tabs, and metrics that take hours to make sense of. You don't have hours. You need to know what's working, what's not, and what to do about it — right now.

Attribution software is noisy

Dozens of dashboards, conflicting numbers, and no clear answer. You spend more time interpreting data than acting on it.

🔍

Double-counted conversions

Meta, Google, and TikTok all claim the same sale. Your actual ROAS is a mystery — and so is your next move.

📊

Hours wasted figuring things out

Exporting CSVs, cross-referencing platforms, building spreadsheets. By the time you find the insight, the opportunity is gone.

💸

No contact-level truth

You see aggregate numbers but can't trace a single customer's journey from first click to final purchase. Decisions stay guesses.

Up and running in minutes.
Seriously.

No engineers. No 6-week implementation. Add one script, connect your accounts, and see data flowing today.

📦

Install the Script

Add a single line of JavaScript. Works with Shopify, WordPress, or any custom build.

🔗

Connect Your Stack

Link ad accounts, Stripe, Calendly, and CRM. Data starts flowing automatically.

🔍

Track Every Touchpoint

Every click, visit, form fill, and purchase captured at the contact level.

📡

Send Quality Conversions

Feed first-party conversion data back to Meta, Google & TikTok with high match rates — training their AI on real results.

🔄

Sync Audiences in Real Time

Automatically move contacts between audiences the moment they convert. No manual lists, no stale segments.

🚀

Optimize & Scale

Use AI recommendations, real-time audiences, and clean data to scale what works.

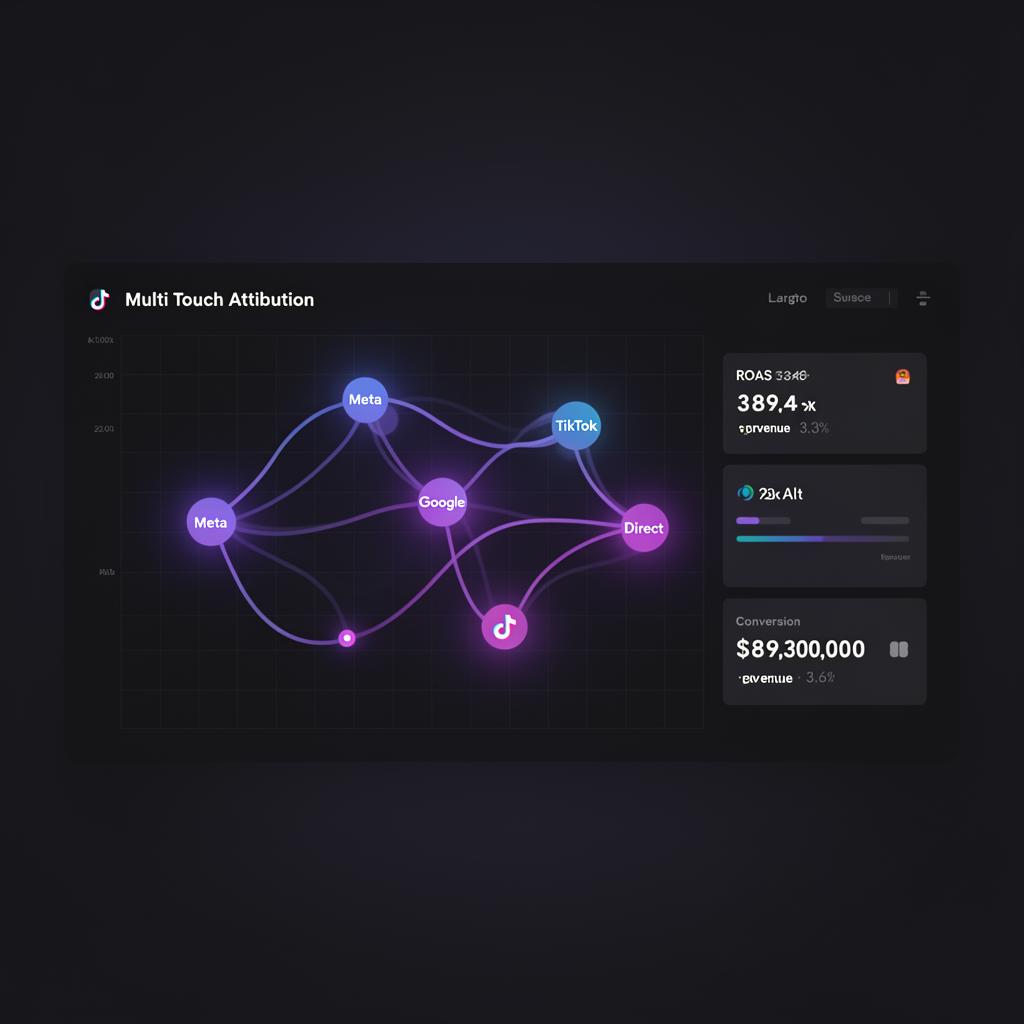
One platform. Every touchpoint.
Complete truth.

Klarvyn replaces guesswork with contact-level data. See the full journey from first click to final purchase.

🎯

AI Attribution

Instantly see which campaign first brought a contact in and which touchpoint sealed the deal.

Conversion Event Sync

Send accurate conversion events back to the ad platforms so their algorithms optimize on real results, not guesses.

👥

Unified Contact Hub

Manage all contacts across Leads, Calls, Purchases, and Subscriptions with powerful filtering and custom columns.

💰

Revenue Attribution

Connect purchases, subscriptions, and LTV back to the exact campaigns, ad sets, and ads that produced them.

📱

Device & UTM Intelligence

Capture device type, OS, browser, and full UTM parameters for every touchpoint.

Ask anything about
your data. Instantly.

Klarvyn's AI isn't limited to campaign metrics. Ask about contacts, revenue trends, funnel performance, product data, audiences, churn — any question about any data point in your account. You can even take action directly: pause campaigns, ad groups, or ads without leaving the conversation. It thinks, recommends, alerts, and executes.

💬

Ask Any Question

Revenue by product? Top converting pages? Contacts with the most touchpoints? Just ask in plain English — get instant, data-backed answers.

🧠

AI Attribution Modeling

ML-powered credit assignment across touchpoints. Goes beyond first/last touch to show the true impact of every channel.

💱

Proactive Recommendations

AI analyzes all your data — campaigns, products, subscriptions, funnels — and surfaces actionable insights you didn't think to ask for.

🚨

Anomaly Detection

Automatically detects unusual patterns across your entire account — CPA spikes, churn surges, funnel drops, tracking failures.

🎮

Campaign Control via Chat

Pause or enable campaigns, ad groups, and individual ads across Meta, Google, and TikTok — all through a simple conversation. No tab-switching required.

Klarvyn AI
Ask anything about your data
What's my churn rate trend over the last 3 months?
Your churn rate has decreased from 3.1% → 2.7% → 2.4% over the last 3 months. The biggest improvement came from contacts tagged "High Value" — their churn dropped 42% after you launched the retention email sequence.↓ 2.4% churn
Which product generates the most revenue per visitor?
High Ticket Offer $6000 generates $18.42 revenue per visitor, 6x higher than your Low Ticket funnel ($2.94/visitor). However, the VSL page only converts 2.3% of visitors — optimizing that page could unlock an estimated $41K/month in additional revenue.💡 Optimize VSL page
Pause the Cold Traffic campaign on Meta.
Done. Cold Traffic — Broad Interests on Meta has been paused. It was spending $142/day with a 1.8x ROAS. I’ll keep monitoring — want me to re-enable it if ROAS improves?⏸ Campaign paused
Ask anything — campaigns, revenue, contacts, funnels, products... or take action.

Reports that make you
look like a genius.

A customizable dashboard and four purpose-built reports that turn raw attribution data into decisions your team can act on today.

Performance Dashboard

Your entire marketing performance at a glance. Fully customizable — drag, drop, and arrange the cards that matter most to your team.

Fully customizable card layout
Sales & revenue metrics in real time
Ad spend, impressions, clicks, CTR & conversions
Performance trends with comparison mode
Campaign breakdown by platform
🏠
Dashboard — Last 30 days
📅 Last 30 days
⚙ Customize
Total Revenue
+18.3% vs prev
$184,200
Total Sales
+12.1% vs prev
847
High Ticket 142
Low Ticket 518
Subscriptions 187
Ad Spend
$24,800
Impressions
480K
Clicks
11,120
Conversions
142
Blended ROAS
7.4x
Revenue vs. Ad Spend
Revenue Ad Spend
Top Campaigns
CampaignPlatformSpendRevenueROAS
TOF - Interest TargetingMeta$5,515$24,5794.2x
Dynamic Product AdsMeta$3,043$22,8945.6x
Brand Search - ExactGoogle$4,200$18,4804.4x
⚙ Drag & drop to customize your dashboard layout • Add or remove cards anytime

Creative Reporting

Analyze creative performance, fatigue metrics, and drill down to ad-level data across all campaigns.

Campaign-level spend, clicks, CPC, leads, calls, customers, revenue & ROAS
Drill into adsets and individual ads
Table and Gallery view modes
Cross-platform creative comparison
Aggregated data across entire ad accounts
🎨
Creative Reporting — Analyze creative performance, fatigue metrics, and drill down to ad-level data
← New Report
Meta Ads
Active Campaigns
💾 Save Report
📁 Campaigns 8
📊 Table
🖼 Gallery
🔍 Search campaigns by name...
Drill Into All →
Campaign Level • Showing all active campaigns
NameStatusSpend ↕Clicks ↕CPC ↕Leads ↕Calls ↕Customers ↕Revenue ↕ROAS ↕
Holiday Retargeting - Q4
ID: camp1
Inactive$2,42711,651
CTR: 2.2%
$0.29283
1.5% conv
36
$101/call
47
$85/cust
$44,0245.40xView Adsets →
TOF - Interest Targeting
ID: camp2
Active$5,51514,972
CTR: 3.0%
$0.83312
1.9% conv
57
$85/call
78
$66/cust
$24,5792.13xView Adsets →
Lookalike - Purchasers
ID: camp3
Active$5,3759,868
CTR: 0.6%
$0.45253
1.0% conv
54
$119/call
65
$79/cust
$12,1933.31xView Adsets →
Brand Awareness - Video
ID: camp4
Active$8,14113,858
CTR: 0.6%
$0.48114
1.6% conv
56
$124/call
33
$110/cust
$40,4803.17xView Adsets →
Dynamic Product Ads
ID: camp5
Active$3,04315,902
CTR: 1.5%
$0.94164
0.8% conv
59
$71/call
84
$128/cust
$22,8945.56xView Adsets →
Summer Sale Campaign
ID: camp6
Inactive$8,59318,280
CTR: 2.9%
$0.27322
1.5% conv
28
$116/call
39
$80/cust
$34,2654.67xView Adsets →

Funnel Reporting

Build and analyze conversion funnels with step-by-step visualization. See exactly where contacts drop off and get AI-powered insights.

Fully customizable funnel stages
Step-by-step conversion visualization
Funnel entries, completions & overall rate
AI-powered funnel insights & recommendations
Device filtering & unique vs. all toggle
Custom reports per funnel — track conversions between steps using the event engine
📉
Funnel Reporting — Build and analyze conversion funnels with step-by-step visualization
Website Signup Flow
4 steps • Last updated: Jan 10, 2026
Last 7 Days ▾
← Exit
Edit Funnel
Conversion Funnel
All Devices ▾
Unique
All
1
Landing Page View
landing_view
100%
4,821
100% from entry
2
Lead
lead
38%
1,832
38% from entry
3
Call
call
12%
578
12% from entry
4
Purchase
purchase
6%
289
6% from entry
Funnel Entries
4,821
Completions
289
Overall Rate
6.0%
Avg Time to Convert
4m 32s
💡 Funnel Insights
The biggest drop-off occurs between step 2 and 3 (69% lost). Consider optimizing your lead capture form.
Mobile users have a 6.3% lower conversion rate. Consider improving mobile experience.

Subscription Reporting

Monitor MRR, churn, LTV, and subscription lifecycle metrics — all attributed back to the campaigns that drive them.

MRR & ARR with campaign attribution
Churn rate & net revenue retention
LTV & LTV:CAC ratio by channel
Revenue retention cohort analysis
Plan distribution & ARPU tracking
MRR movement breakdown (new, expansion, contraction, churned)
📊
Subscription Metrics — Monitor MRR, churn, LTV, and subscription lifecycle metrics
Period:
Last Month ▾
Compare:
⬇ Export
MRR
$127,450
+8.3% vs $117,680
ARR
$1.53M
+8.3% vs $1.41M
Net Revenue Retention
112%
+3pts vs 109%
Churn Rate
2.4%
-0.3pts vs 2.7%
LTV
$4,850
+12.4% vs $4,315
LTV:CAC Ratio
4.2x
+0.4x vs 3.8x
MRR Trend
Monthly recurring revenue over time
Trend
Waterfall
$99k
Jul
$104k
Aug
$110k
Sep
$115k
Oct
$118k
Nov
$127k
Dec
New MRR Expansion Contraction Churned
MRR Movement
December 2024
New MRR
+$12,450
Expansion
+$4,320
Contraction
-$1,890
Churned
-$5,110
Net MRR Change +$9,770
Plan Distribution
Active subscriptions by plan
847
Active Subscribers
$150
ARPU
68%
Annual Plans
23
Trials Active
Starter
382 subs • $19,100/mo
Professional
322 subs • $48,300/mo
Enterprise
143 subs • $60,050/mo
Revenue Retention Cohorts
% of revenue retained by signup month
Revenue
Customers
CohortM0M1M2M3M4M5
Jun 2024100%96%94%92%95%98%
Jul 2024100%94%91%88%90%94%
Aug 2024100%97%95%96%99%-
Sep 2024100%95%93%97%--
Oct 2024100%98%101%---
Recent Subscriptions
Latest subscription activity
All
New
Churned
Upgraded
CustomerPlanStatusMRRLTVStartedBillingActivity
Acme Corporation
EnterpriseActive$899$10,788Jan 15, 2024Annual↑ Renewed
TechStart Inc
ProfessionalActive$199$2,388Mar 22, 2024Monthly↑ Upgraded
Global Media Ltd
EnterpriseActive$599$7,188Feb 10, 2024AnnualActive
Sarah Johnson
StarterTrialing--Dec 28, 2024MonthlyTrial Day 3

Product Performance

Track product-level metrics, revenue, and inventory performance with category filtering and period comparisons.

Per-product & SKU-level revenue attribution
Category filtering (Digital, SaaS, Physical)
Period-over-period comparison toggle
Avg order value & revenue per product
📦
Product Performance — Track product-level metrics, revenue, and inventory performance
Date:
Last 30 Days ▾
Category:
All Categories ▾
Compare:
⬇ Export
Total Revenue
$184,200
Units Sold
847
Avg Order Value
$217.47
Products
3
Top Category
Digital
Avg Revenue/Product
$61,400
🔍 Search by product name or SKU...
ProductCategoryUnits SoldPriceRevenueSKU
📦
High Ticket Offer $6000
Digital Product142$6,000.00$852,000HT-PROD
📦
Low Ticket Offer $29
Digital Product518$29.00$15,022LT-PROD
📦
Monthly Subscription $49
SaaS187$49.00$9,163MS-PROD

See the data. Take action.
All in one place.

Stop switching between Meta, Google, and TikTok dashboards. Control your campaigns, ad sets/ad groups, and individual ads directly from Klarvyn — or just ask the AI to do it for you.

📢
Ad Manager — Control campaigns, ad sets & ads across all platforms
● Meta Ads
○ Google Ads
○ TikTok Ads
○ All Platforms
Last 7 Days
🔄 Sync
Campaigns
Ad Sets / Ad Groups
Ads
Campaign Level • Showing 8 campaigns
Active Campaigns
5 of 8
Total Spend
$33,094
Avg ROAS
3.8x
Daily Budget
$4,728/day
On/OffCampaignStatusDaily BudgetSpendROASConversionsCPA
TOF - Interest Targeting
Meta Ads • CBO
Active $800/day$5,5154.2x78$70.71 Edit →
Lookalike - Purchasers
Meta Ads • ABO
Active $750/day$5,3753.3x65$82.69 Edit →
Dynamic Product Ads
Meta Ads • DPA
Active $450/day$3,0435.6x84$36.23 Edit →
Retargeting - Website Visitors
Meta Ads • CBO
Active $500/day$3,4275.4x47$72.91 Edit →
Holiday Retargeting - Q4
Meta Ads • CBO
Off $350/day$00 Edit →
Cold Traffic - Broad
Meta Ads • CBO
Paused $1,000/day$00 Edit →

Know your funnel's
health score instantly.

Automated diagnostics identify conversion bottlenecks before they drain your budget. Get a health score, critical alerts, and actionable suggestions.

Overall health score across 6 diagnostic metrics
Ad fatigue monitoring with CTR decay analysis
Landing page efficiency tracking
Product discovery and cart abandonment rates
Actionable suggestions for each bottleneck
Critical / Warning / OK severity classification
🛡
Diagnostics — Identify and resolve conversion bottlenecks
Overall Health Score
Based on 6 diagnostic metrics
2
Critical
1
Warnings
3
OK
Health Score
60/100
Some areas need attention. Review warnings below.

✅ Ad Fatigue Score

8.2%
Measures CTR decline over time. High values indicate ads are becoming stale.
Threshold: < 15% • Healthy

❌ Landing Page Efficiency

34.1%
Percentage of ad clicks that result in landing page views.
💡 Improve page load speed, ensure mobile optimization, and verify URLs.

⚠ Product Discovery Rate

51.7%
Percentage of landing page visitors who view a product.
💡 Improve product visibility, add clear CTAs, and consider recommendations.

✅ Cart Abandonment Rate

62.4%
Percentage of carts that do not convert to purchases.
Threshold: < 70% • Healthy

✅ Checkout Completion

78.3%
Percentage of checkout initiations that complete successfully.
Threshold: > 60% • Healthy

❌ Lead-to-Call Rate

11.9%
Percentage of leads that book a call within 7 days.
💡 Review follow-up sequences, optimize booking page, and reduce friction.

What if problems
found you first?

Stop manually checking dashboards. Klarvyn monitors everything and alerts your team in Slack the moment something needs attention.

🔥

Ad Fatigue Alerts

Smart

Monitors frequency, declining CTR, and rising CPA together. Detects creative fatigue before full performance collapse.

🔧

Diagnostic Alerts

Critical

Monitors both tracking health (pixel firing, data pipeline) and campaign performance anomalies (CPA spikes, conversion drops).

📢

Slack Reporting

Live

Automated daily and weekly performance reports to any Slack channel. Custom schedules, custom metrics.

🔔
Alerts Hub — Manage workflows
+ New Workflow
Active 3
Paused 1
Drafts 0
Daily Performance Report
Report • Daily at 09:00
ACTIVE
Success Rate 100%
Last Run Mar 23
Next Run Mar 24
[email protected] • #marketing-alerts
Ad Fatigue Monitor
Alert • Real-time
ACTIVE
✉ #marketing-alerts • Triggers: Frequency > 4.0, CTR drop > 25%
# marketing-alerts
Klarvyn Bot 10:02 AM
🔥 Ad Fatigue Alert
"Carousel — Features" frequency hit 4.8, CTR dropped 32% in 7 days.
Freq: 4.8 CTR: -32%
Klarvyn Bot 9:15 AM
📊 Daily Report
47 leads, 12 purchases, $18,420 revenue. Meta 3.8x, Google 2.9x.
$18,420 ↗ +14%

Your audiences & conversions,
always in sync. Always fresh.

A lead converts, and within seconds they're removed from prospecting audiences and added to upsell audiences across every platform. Meanwhile, quality first-party conversion data flows back to Meta, Google, and TikTok in real time — training their algorithms on real results, not guesses. That's Klarvyn.

Events & Audiences — Manage events, conversions, audience segments, and contact tags
Events 8
Conversions 3
Audiences 2
Tags 4
Create dynamic audience segments
🔍 Search audiences...
👥
High-Value Purchasers
847 members • 30 day retention
⚡ Synced
3 rules
🔔
📤
👥
Active Leads (Last 14d)
312 members • 14 day retention
⚡ Synced
2 rules
🔔
📤
👥
Cart Abandoners - Retarget
1,204 members • 7 day retention
⚡ Synced
1 rule
🔔
📤
Events & Audiences — Send quality conversions back to ad platforms
Events 8
Conversions 3
Audiences 2
Tags 4
Mappings
Conversion Log
📡
Feed ad platform AI with quality first-party data
Map your events to platform conversions with high match rates. The better your data, the better Meta, Google & TikTok optimize your campaigns.
94.2%
Avg Match Rate
All Events ▾
All Platforms ▾
🔍 Search Conversions...
EventPlatformMatch RateStatusValueFrequency
LeadMeta, Google96.1%✓ SendingOnce
Call BookedMeta93.8%✓ SendingEvery
PurchaseMeta, Google, TikTok95.4%✓ SendingOnce
Purchase HighticketMeta, Google91.7%✓ Sending$5,000Once
Events & Audiences — Conversion Log
Events 8
Conversions 3
Audiences 2
Tags 4
Mappings
Conversion Log
All Events ▾
All Platforms ▾
All Status ▾
Last 7 days ▾
TimeEventPlatformContactValueStatus
Today 2:45 PMLeadM Meta[email protected]$50✅ Sent
Today 2:45 PMLeadG Google[email protected]✅ Sent
Today 2:42 PMPurchaseM Meta[email protected]$299✅ Sent
Today 2:38 PMLeadM Meta[email protected]$50⚠ Retrying
Today 2:35 PMCall BookedM Meta[email protected]✅ Sent
Today 2:31 PMLeadM Meta[email protected]$50❌ Failed
1,245 sent 12 retrying 3 failed (last 7 days)
← Prev Page 1 of 52 Next →
Events & Audiences — Tags
Events 8
Conversions 3
Audiences 2
Tags 6
6 tags
ColorTag NameAuto-ApplyContacts
High Value When purchase > $500 842 Edit • Delete
Churned No activity 60 days 156 Edit • Delete
VIP Lead Lead score ≥ 80 321 Edit • Delete
Repeat Buyer Purchases ≥ 2 589 Edit • Delete
Call Booked Manual only 1,204 Edit • Delete
At Risk Churn score > 70% 93 Edit • Delete
6 tags • 3,205 total tagged contacts 5 auto-apply rules active
Events & Audiences — Events
Events 8
Conversions 3
Audiences 2
Tags 6
8 events • 1 system • 7 custom
Event NameTypeTrigger Rule30D CountStatus
Page View System All page loads 48,291 ● Active View
Visited VSL Page Custom URL contains /vsl 12,847 ● Active Edit
Visited Pricing Page Custom URL contains /pricing 8,432 ● Active Edit
Visited Testimonial Page Custom URL contains /testimonials 3,156 ● Active Edit
Checked The Demo Custom URL contains /demo 2,589 ● Active Edit
Call Show-Up Custom Webhook: call.showed_up 421 ● Active Edit
Call Booked Custom URL contains /booking-confirmed 578 ● Active Edit
Purchase Custom URL contains /order-confirmed 289 ● Active Edit
8 events • 76,603 total events (30 days) All events active

Built-in compliance. Custom tracking domains.

GDPR

EU compliant

CCPA

California compliant

LGPD

Brazil compliant

🌐

Custom Domains

Bypass ad blockers

🛡

Privacy Portal

Data retention controls

Enterprise-grade control.
Developer-friendly API.

Manage roles, permissions, and integrate Klarvyn into your stack with a powerful REST API and real-time webhooks.

Settings — Team
General
Billing
Team 5
Notifications
API
Team Members
Manage who has access to your workspace
MemberRoleLast ActiveStatus
MR
Marcus Reid
Owner Just now ● Online
SM
Sarah Mitchell
Admin 2 hours ago ● Online Edit • Remove
JC
James Chen
Analyst Yesterday ● Offline Edit • Remove
AL
Analyst 3 days ago ● Offline Edit • Remove
?
Pending invite
Viewer Invited Mar 22 ● Pending Resend • Revoke
Role Permissions
Owner — Full access, billing, delete workspace
Admin — Manage team, settings, integrations
Analyst — View reports, create audiences
Viewer — Read-only dashboard access

Connects to your
entire growth stack.

Native integrations with the tools you already use. Set up in clicks, not weeks.

All
Ad Platforms
Payment Processors
CRM
Notifications & Tasks
Automation

Meta Ads

● Connected

Google Ads

● Connected

TikTok Ads

● Connected

LinkedIn Ads

● Connected

Stripe

● Connected

HubSpot

Coming Soon

Salesforce

Coming Soon

Slack

● Connected

Don't take our word for it.

Hear from the growth teams who stopped guessing and started growing.

★★★★★
The AI chat is like having a data analyst on call 24/7. I just ask "what drove the most revenue this week?" and get an instant answer with recommendations.
JR
Jake Reynolds
Head of Growth, eComm Brand
★★★★★
The ad fatigue alerts saved us thousands. We caught a creative dying 3 days before our CPA would have spiked. The Slack integration means the whole team sees it instantly.
AL
Amanda Liu
Marketing Director, SaaS
★★★★★
We replaced three tools with Klarvyn. The real-time audience sync alone pays for itself — our lookalikes are finally built on real buyers, not inflated pixel data.
DP
David Park
Performance Lead, Agency

Simple pricing.
Serious results.

Select your monthly ad revenue. Upgrade or downgrade anytime.

Billed monthly. Switch to yearly and save 36%!
Starter
Up to $75K/mo in ad revenue
$299/mo
Billed monthly
AI attribution modeling
Contact-level tracking
Full reporting suite
Real-time audience sync
Conversion event sync
AI chat with your data
Diagnostics & alerts
Slack automated reports
Ad Manager controls
Unlimited integrations
Get Started
All plans include every feature. Only pay for the revenue you manage.

Stop guessing.
Start attributing.

You're 10 minutes away from seeing which campaigns actually make you money. No credit card, no commitment, no risk.